
We are happy to announce the new 2.2 release with new interactive visualization of spectral indices, per-pixel regression, and snapshot support in perClass Mira Runtime.
perClass Mira 2.2 packs a large set of new functionality including:
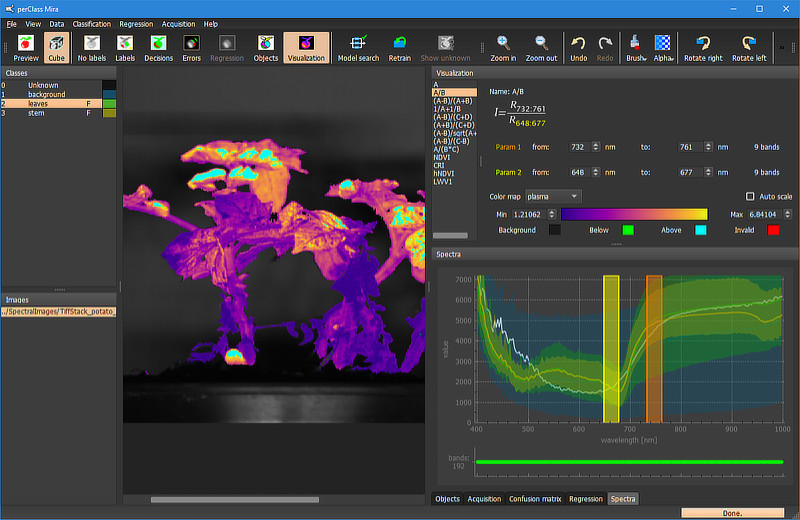
Visualization mode gives extra insight into hidden content of spectral cubes. User can now easily apply common equations defined by wavelengths or wavelength ranges. Because the visualization can be easily applied only to objects in foreground, this allows to quickly focus on relevant information such as chlorophyll content.
Watch short tutorial video demonstrating the visualization:
Also regression results can now be visualized per-pixel. For example, here we have a moisture distribution estimated in a cookie:

Regression annotations can now be imported from Excel files and regression results exported into Excel on per-object basis.
enables object classification for all configurations provided by object segmentation panel in the GUI. This also includes access to per-object content (number of specific class pixels) and per-object classification rules. New snapshot mode is introduced allowing to process entire spectral cubes at once.
See all release notes in the documentation.